Most "self-host an LLM \ llm-d" posts and guides I see in the internet either stop at docker run vllm/vllm-openai under a single GPU or just talk theories of llm-d. This is the other side. This is the runbook I wrote while setting up to run open-weight coding
models as a production inference stack on kubernetes.
GPUs that appear and vanish on demand, models served under frameworks, autoscaling driven by queue depth instead of CPU%, a single hardened gateway in front, full observability, and a fallback so no users ever hits a wall.
It's copied more or less straight from my build notes, warts and all: the OOM, the
Pending pod that never scheduled, and everything in between.
Three threads run through it:
- Managing GPUs in Kubernetes. They're expensive, discrete, and awkward in ways CPU nodes never are. Getting this right is most of the work.
- Serving models the production way. vLLM under llm-d v0.8.1, deployed under different guides, behind one OpenAI-compatible gateway.
- Scaling it, and the economics. Where in-house inference stops being a POC and starts being something you can defend on a spreadsheet.
Everything here is backed by manifests of production running cluster in
gd03champ/inference-infra. I link the
exact files as we go.
Fair warning on scope: this is long. It's a runbook, not a teaser. Grab a coffee, or jump straight to the economics section if you just want the case for in-house.
The inference stack#
The cast, and why each one is here:
- vLLM is the inference serving engine.
- KEDA is like HPA but scales on real-time events, not just CPU. Here that event is a vLLM/EPP metric.
- GAIE is the Gateway API Inference Extension.
- llm-d is the router plus model server. It integrates LMCache as a pluggable KV-cache manager, and LMCache uses NVIDIA's NIXL to offload/move caches over whatever route is best, which on AWS means EFA.
- Karpenter provisions and consolidates nodes. Istio + cert-manager give TLS ingress. Bifrost is the AI gateway. kube-prometheus-stack + DCGM give observability. Open WebUI is a test UI.
Here's the whole architecture on one page:
The plan, before any of this#
The target was Claude Code compatible coding on an open model, specifically
glm-5.2-fp8, whose performance goes hand in hand with sonnet-5. The back ßof envelope:
- A single
p5e.48xlargecan hold about 30 concurrent users at 128k context window. - Shut GPU nodes down at night, fall back to Claude for the stragglers.
- Roll out to a selected pool of users. On a queue overfill (say 30 deep), overflow falls back to Claude too.
- In Portkey/Bifrost, set the self-hosted cost equal to
sonnet-5, then compute real savings as the cluster cost delta. - Squeeze more concurrency later with llm-d disaggregation.
Deployment plan: start with a single llm-d inference pool, then disaggregate. Hold that thought, the frontier model has a surprise for us later.
Cluster config#
EKS with these addons: CoreDNS, kube-proxy, Prometheus Node Exporter, Amazon VPC CNI, External DNS, Amazon EKS Pod Identity Agent, Node monitoring agent, Metrics Server. Pod Identity is the one to note, it's how every IAM binding below is wired, no long-lived keys anywhere.
Set the env and let's go:
export CLUSTER_NAME="genai-systems"
export AWS_REGION="ap-south-1"
1: Karpenter and GPU nodes#
The single most expensive mistake in this whole stack is an idle GPU node. A
g6e.16xlarge is not something you leave running "just in case." So nodes have to be
genuinely just in time. Karpenter is how.
IAM role for the Karpenter controller
Pod Identity trust policy, then create the role:
{
  "Version": "2012-10-17",
  "Statement": [{
    "Effect": "Allow",
    "Principal": {"Service": "pods.eks.amazonaws.com"},
    "Action": ["sts:AssumeRole", "sts:TagSession"]
  }]
}aws iam create-role \
--role-name KarpenterControllerRole-${CLUSTER_NAME} \
--assume-role-policy-document file://karpenter-controller-trust-policy.jsonBind the role to the ServiceAccount via Pod Identity
aws eks create-pod-identity-association \
  --cluster-name $CLUSTER_NAME \
  --namespace kube-system \
  --service-account karpenter \
  --role-arn arn:aws:iam::$AWS_ACCOUNT_ID:role/KarpenterControllerRole-$CLUSTER_NAME
Which gives back the association:
{
  "association": {
    "clusterName": "genai-systems",
    "namespace": "kube-system",
    "serviceAccount": "karpenter",
    "roleArn": "arn:aws:iam::978983596161:role/KarpenterControllerRole-genai-systems",
    "associationId": "a-q9tiwo8y0jwnlqve9",
    "disableSessionTags": false
  }
}
CloudFormation stack for Karpenter's runtime resources
This creates the IAM role and policies for nodes, the SQS InterruptionQueue, and the EventBridge rules that watch EC2 node status:
curl -fsSL https://raw.githubusercontent.com/aws/karpenter-provider-aws/v${KARPENTER_VERSION}/website/content/en/preview/getting-started/getting-started-with-karpenter/cloudformation.yaml -o karpenter-cf.yaml

aws cloudformation deploy \
  --stack-name "Karpenter-$CLUSTER_NAME" \
  --template-file karpenter-cf.yaml \
  --capabilities CAPABILITY_NAMED_IAM \
--parameter-overrides "ClusterName=$CLUSTER_NAME"Waiting for changeset to be created..
Waiting for stack create/update to complete
Successfully created/updated stack - Karpenter-genai-systems
Install Karpenter via Helm
Small catch here: Karpenter needs some compute to run on before it can create any nodes, and it shouldn't run on the nodes it manages. So I ran it on a 2-node managed nodegroup to bootstrap. Affinities and taints to fully isolate it can go in later.
helm upgrade --install karpenter oci://public.ecr.aws/karpenter/karpenter \
  --version "$KARPENTER_VERSION" \
  --namespace kube-system \
  --set settings.clusterName=$CLUSTER_NAME \
  --set settings.interruptionQueue=$CLUSTER_NAME \
  --set controller.resources.requests.cpu=1 \
  --set controller.resources.requests.memory=1Gi \
  --wait
Tag subnets (and a security group) for discovery
Karpenter finds subnets and SGs by the karpenter.sh/discovery tag. One subnet per AZ so
it has choice, and at least one SG or the nodeclass/pool won't work. I tagged the
auto-generated SG of the base nodegroup for a simpler setup and to dodge future errors.
aws ec2 create-tags --resources subnet-0c863ec7206e5ff8b \
  --tags Key=karpenter.sh/discovery,Value=$CLUSTER_NAME
aws ec2 create-tags --resources subnet-03f2e091957d63eb8 \
  --tags Key=karpenter.sh/discovery,Value=$CLUSTER_NAME
aws ec2 create-tags --resources subnet-0a25daa0d73054991 \
  --tags Key=karpenter.sh/discovery,Value=$CLUSTER_NAME
The NodePools, where the models live#
Now the interesting part. Two rules I baked into the GPU pools:
- Consolidation on GPU pools is
1mto save cost fast. Idle GPUs die quickly. - Prefill gets spot, decode gets on-demand. Spot GPU instances save 60-70%. A killed prefill worker just retries and can tolerate the ~2 minute spot callback. A killed decode worker cuts off a user mid-generation, which it cannot.
Full file: karpenter/nodepools.yaml
and karpenter/ec2-nodeclasses.yaml.
Here are the two GPU pools that carry the whole idea:
# Prefill pool - GPU, spot-tolerant (a killed prefill worker just retries)
apiVersion: karpenter.sh/v1
kind: NodePool
metadata: {name: prefill}
spec:
  template:
    metadata:
      labels: {llm-d.ai/role: prefill}
    spec:
      requirements:
        - {key: node.kubernetes.io/instance-type, operator: In, values: ["g5.xlarge","g5.2xlarge","g6.xlarge","g6.2xlarge"]}
        - {key: karpenter.sh/capacity-type, operator: In, values: ["spot","on-demand"]}
      nodeClassRef: {group: karpenter.k8s.aws, kind: EC2NodeClass, name: gpu}
      taints:
        - {key: llm-d.ai/role, value: prefill, effect: NoSchedule}
  disruption: {consolidationPolicy: WhenEmptyOrUnderutilized, consolidateAfter: 1m}
  limits: {cpu: 64, memory: 256Gi, nvidia.com/gpu: 8}
---
# Decode pool - GPU, on-demand only (mid-generation kills are user-visible)
apiVersion: karpenter.sh/v1
kind: NodePool
metadata: {name: decode}
spec:
  template:
    metadata:
      labels: {llm-d.ai/role: decode}
    spec:
      requirements:
        - {key: node.kubernetes.io/instance-type, operator: In, values: ["g5.xlarge","g5.2xlarge","g6.xlarge","g6.2xlarge"]}
        - {key: karpenter.sh/capacity-type, operator: In, values: ["on-demand"]}
      nodeClassRef: {group: karpenter.k8s.aws, kind: EC2NodeClass, name: gpu}
      taints:
        - {key: llm-d.ai/role, value: decode, effect: NoSchedule}
  disruption: {consolidationPolicy: WhenEmptyOrUnderutilized, consolidateAfter: 1m}
  limits: {cpu: 64, memory: 256Gi, nvidia.com/gpu: 8}
Apply the nodeclasses and pools:
kubectl apply -f karpenter/ec2-nodeclasses.yaml
kubectl apply -f karpenter/nodepools.yaml
The NVIDIA device plugin (the step that trips people)#
The AMI has drivers, but nvidia.com/gpu won't show up as a schedulable resource until
this DaemonSet runs. And it needs to tolerate the GPU taint so it can actually land on the
tainted nodes:
helm repo add nvdp https://nvidia.github.io/k8s-device-plugin
helm upgrade --install nvdp nvdp/nvidia-device-plugin \
  --namespace kube-system \
  --set tolerations[0].key=llm-d.ai/role \
  --set tolerations[0].operator=Exists \
  --set tolerations[0].effect=NoSchedule
Smoke test: does the whole chain actually work?#
Before serving a token, let's prove it. Run a CUDA container pinned to the decode selector.
Karpenter should spin up a GPU node under decode, the scheduler should place the pod, and
nvidia-smi should return GPU data from inside the pod:
apiVersion: v1
kind: Pod
metadata: {name: cuda-test}
spec:
  tolerations:
    - {key: llm-d.ai/role, operator: Exists, effect: NoSchedule}
  nodeSelector: {llm-d.ai/role: decode}
  containers:
    - name: cuda-check
      image: nvidia/cuda:12.4.0-base-ubuntu22.04
      command: ["nvidia-smi"]
restartPolicy: Neverkubectl apply -f karpenter/gpu-smoke-test.yaml
kubectl logs cuda-testAnd there it is, a real GPU from inside a pod on a node that didn't exist ninety seconds ago:
+-----------------------------------------------------------------------------------------+
| NVIDIA-SMI 580.159.03             Driver Version: 580.159.03     CUDA Version: 13.0     |
+-----------------------------------------+------------------------+----------------------+
|   0  NVIDIA L4                      Off |   00000000:31:00.0 Off |                    0 |
| N/A   43C    P8             13W /   72W |       0MiB /  23034MiB |      0%      Default |
+-----------------------------------------+------------------------+----------------------+
| Processes:  No running processes found                                                  |
+-----------------------------------------------------------------------------------------+
Delete the pod and the node gets taken out with it, since we gave consolidateAfter: 1m.
The whole GPU lifecycle in one test.
crazy.
Karpenter spinning up a g-series node on demand, the CUDA pod attaching to the GPU.
2: What you actually need to understand about GPUs in kubernetes#
Quick understanding, because this would shaped every instance decision that follows down. This isn't optional to know, it's the physics the kube scheduler works on.
The rules of GPU in this cluster:
g5andg6use NVIDIA A10G and L4, each holding 24 GB of VRAM. When onenvidia.com/gpuis allocated to a pod, it holds 24 GB.- A single node can have more GPUs depending on instance type (
g5.12xlarge= 4× A10G,g5.48xlarge= 8× A10G). Only then does tensor parallelism (TP) activate, for models that don't fit in 24 GB. - AWS does provide fractional-GPU instances (the
g6ffamily), but a model still has to load fully within a single node to work normally. - To split a model across nodes you need pipeline parallelism (PP), where model layers are split across GPU nodes via Ray in vLLM. This is how the very big 500B+ models get served.
- When a pod gets 1 GPU, it provisions on the node fully taking over the GPU. Another
pod can't share it. That's what
nvidia-device-pluginenforces. Fractional allocation is not possible, it's strongly discrete. Even if you hacked Kubernetes to do it, the pods would share the same memory pool and fall over.
Keep that last point in mind. It's about to decide whether a frontier model runs at all.
3: Ingress and TLS with Istio + cert-manager#
A model server without secure entrypoint isn't usefull. So next is the ingress.
Gateway API CRDs (Istio needs them)
kubectl apply -f https://github.com/kubernetes-sigs/gateway-api/releases/download/v1.3.0/standard-install.yamlcert-manager, for TLS
helm repo add jetstack https://charts.jetstack.io
helm upgrade --install cert-manager jetstack/cert-manager \
  --namespace cert-manager --create-namespace \
  --set crds.enabled=true --wait
It reminds you that certs need a ClusterIssuer or Issuer before anything gets signed. We'll do that once the LB controller is in.
Istio: base + istiod, no ingress workload yet
Base is the CRDs, istiod is the control plane. No separate ingress gateway workload, the
Gateway resource itself makes Istio stand up the proxy.
kubectl create namespace istio-system
helm repo add istio https://istio-release.storage.googleapis.com/charts
helm upgrade --install istio-base istio/base -n istio-system --set defaultRevision=default --wait
helm upgrade --install istiod istio/istiod -n istio-system --wait
AWS Load Balancer Controller#
Same Pod Identity pattern as Karpenter: policy, role, association, then the chart.
curl -o lbc-iam-policy.json https://raw.githubusercontent.com/kubernetes-sigs/aws-load-balancer-controller/main/docs/install/iam_policy.json
aws iam create-policy --policy-name AWSLoadBalancerControllerIAMPolicy --policy-document file://lbc-iam-policy.json

aws iam create-role --role-name AWSLoadBalancerControllerRole-${CLUSTER_NAME} \
  --assume-role-policy-document '{"Version":"2012-10-17","Statement":[{"Effect":"Allow","Principal":{"Service":"pods.eks.amazonaws.com"},"Action":["sts:AssumeRole","sts:TagSession"]}]}'

aws iam attach-role-policy --role-name AWSLoadBalancerControllerRole-${CLUSTER_NAME} \
  --policy-arn arn:aws:iam::${AWS_ACCOUNT_ID}:policy/AWSLoadBalancerControllerIAMPolicy

aws eks create-pod-identity-association --cluster-name ${CLUSTER_NAME} \
  --namespace kube-system --service-account aws-load-balancer-controller \
  --role-arn arn:aws:iam::${AWS_ACCOUNT_ID}:role/AWSLoadBalancerControllerRole-${CLUSTER_NAME}

helm repo add eks https://aws.github.io/eks-charts
helm upgrade --install aws-load-balancer-controller eks/aws-load-balancer-controller \
  -n kube-system \
  --set clusterName=${CLUSTER_NAME} \
  --set serviceAccount.name=aws-load-balancer-controller \
  --set vpcId=$VPC_ID \
  --set region=$AWS_REGION
Teach cert-manager the Gateway API, then set the issuer#
By default cert-manager knows Ingress, not Gateway API. Flip it on:
helm upgrade cert-manager jetstack/cert-manager \
  --namespace cert-manager --reuse-values \
  --set config.apiVersion=controller.config.cert-manager.io/v1alpha1 \
  --set config.kind=ControllerConfiguration \
  --set config.enableGatewayAPI=true \
  --wait
Then the ClusterIssuer, a cluster-wide CA that can sign certs across all namespaces
(gateway/letsencrypt-http01.yaml):
apiVersion: cert-manager.io/v1
kind: ClusterIssuer
metadata: {name: letsencrypt-http01}
spec:
  acme:
    server: https://acme-v02.api.letsencrypt.org/directory
    email: gd03n@gmail.com
    privateKeySecretRef: {name: letsencrypt-http01-key}
    solvers:
      - http01:
          gatewayHTTPRoute:
            parentRefs:
              - {name: cluster-gateway, namespace: istio-system, kind: Gateway}
The Gateway#
A few things going on in
gateway/cluster-gateway.yaml:
- GatewayClass is predefined when installing Istio, we pick
istio. - We do HTTP-01 cert validation: the cert is received by connecting to the Let's Encrypt server and self-resolving a challenge that cert-manager auto-adds to the subdomain. (You could do DNS-01 by importing a TLD cert from ACM. HTTP-01 was simpler.)
pl-0bbaf5fc07815e736is an AWS prefix list configured for IP whitelisting the internet-facing ingress LB.
Once the gateway is applied, cert-manager sets up a temp HTTPRoute and challenge-serving pods on the domain, which auto-resolve.
kubectl apply -f gateway/cluster-gateway.yamlNow wait for the challenge. It might take multiple attempts. If one fails, deleting the cert restarts the process. Once orders are received and the cert is valid, the temp HTTPRoute and serving pods go down, and you can add real backend routes.
kubectl get certificates,challenges,orders -AThis step would test your patience, like it did mine. Certs can bounce a few times before they take. Deleting a stuck cert to restart the ACME flow would help at times.
Certs Ready, challenges resolved, orders complete. The temp solver pods are gone.
Then routes point at real backends, e.g. Grafana:
apiVersion: gateway.networking.k8s.io/v1
kind: HTTPRoute
metadata: {name: grafana, namespace: monitoring}
spec:
  parentRefs:
    - {name: cluster-gateway, namespace: istio-system, sectionName: https-grafana}
  hostnames: ["watchme.gd03.me"]
  rules:
    - backendRefs: [{name: kube-prometheus-stack-grafana, port: 80}]
4: Observability, wired before we need it#
We don't want inference to run as headless chicken so we'll do this first. Three sources, one Prometheus, all in
Grafana at watchme.gd03.me.
EBS CSI driver, so kube-prometheus-stack can use PVCs
aws iam create-role --role-name AmazonEKS_EBS_CSI_DriverRole-${CLUSTER_NAME} \
  --assume-role-policy-document '{"Version":"2012-10-17","Statement":[{"Effect":"Allow","Principal":{"Service":"pods.eks.amazonaws.com"},"Action":["sts:AssumeRole","sts:TagSession"]}]}'

aws iam attach-role-policy --role-name AmazonEKS_EBS_CSI_DriverRole-${CLUSTER_NAME} \
  --policy-arn arn:aws:iam::aws:policy/service-role/AmazonEBSCSIDriverPolicy

aws eks create-addon --cluster-name ${CLUSTER_NAME} --addon-name aws-ebs-csi-driver \
  --pod-identity-associations serviceAccount=ebs-csi-controller-sa,roleArn=arn:aws:iam::${AWS_ACCOUNT_ID}:role/AmazonEKS_EBS_CSI_DriverRole-${CLUSTER_NAME}
kube-prometheus-stack
Node exporters off (the EKS addon covers them), Prometheus and Grafana on gp3 PVCs. Values
in monitoring/promstack-values.yaml:
prometheus-node-exporter: {enabled: false}
nodeExporter: {enabled: false}
prometheus:
  prometheusSpec:
    storageSpec:
      volumeClaimTemplate:
        spec:
          storageClassName: gp3
          resources: {requests: {storage: 20Gi}}
grafana:
persistence: {enabled: true, storageClassName: gp3, size: 5Gi}helm upgrade --install kube-prometheus-stack prometheus-community/kube-prometheus-stack \
-n monitoring -f promstack-values.yamlDCGM exporter, for GPU metrics off the g-series nodes
Only on GPU nodes, tolerating the llm-d.ai/role taint. Values in
monitoring/dcgm-exporter-values.yaml:
nodeSelector: {nvidia.com/gpu.present: "true"}   # target only GPU nodes
tolerations:
  - {key: llm-d.ai/role, operator: Exists, effect: NoSchedule}
serviceMonitor:
  enabled: true
  honorLabels: true
  namespace: monitoring
additionalLabels: {release: kube-prometheus-stack}helm upgrade --install dcgm-exporter gpu-helm-charts/dcgm-exporter -n monitoring -f dcgm-exporter-values.yamlThe one catch that ate my afternoon: every ServiceMonitor and
PodMonitor needs release: kube-prometheus-stack in its labels, or this Prometheus
just won't select it. No error. No data. You see it repeated in every monitor in the repo
for exactly this reason.
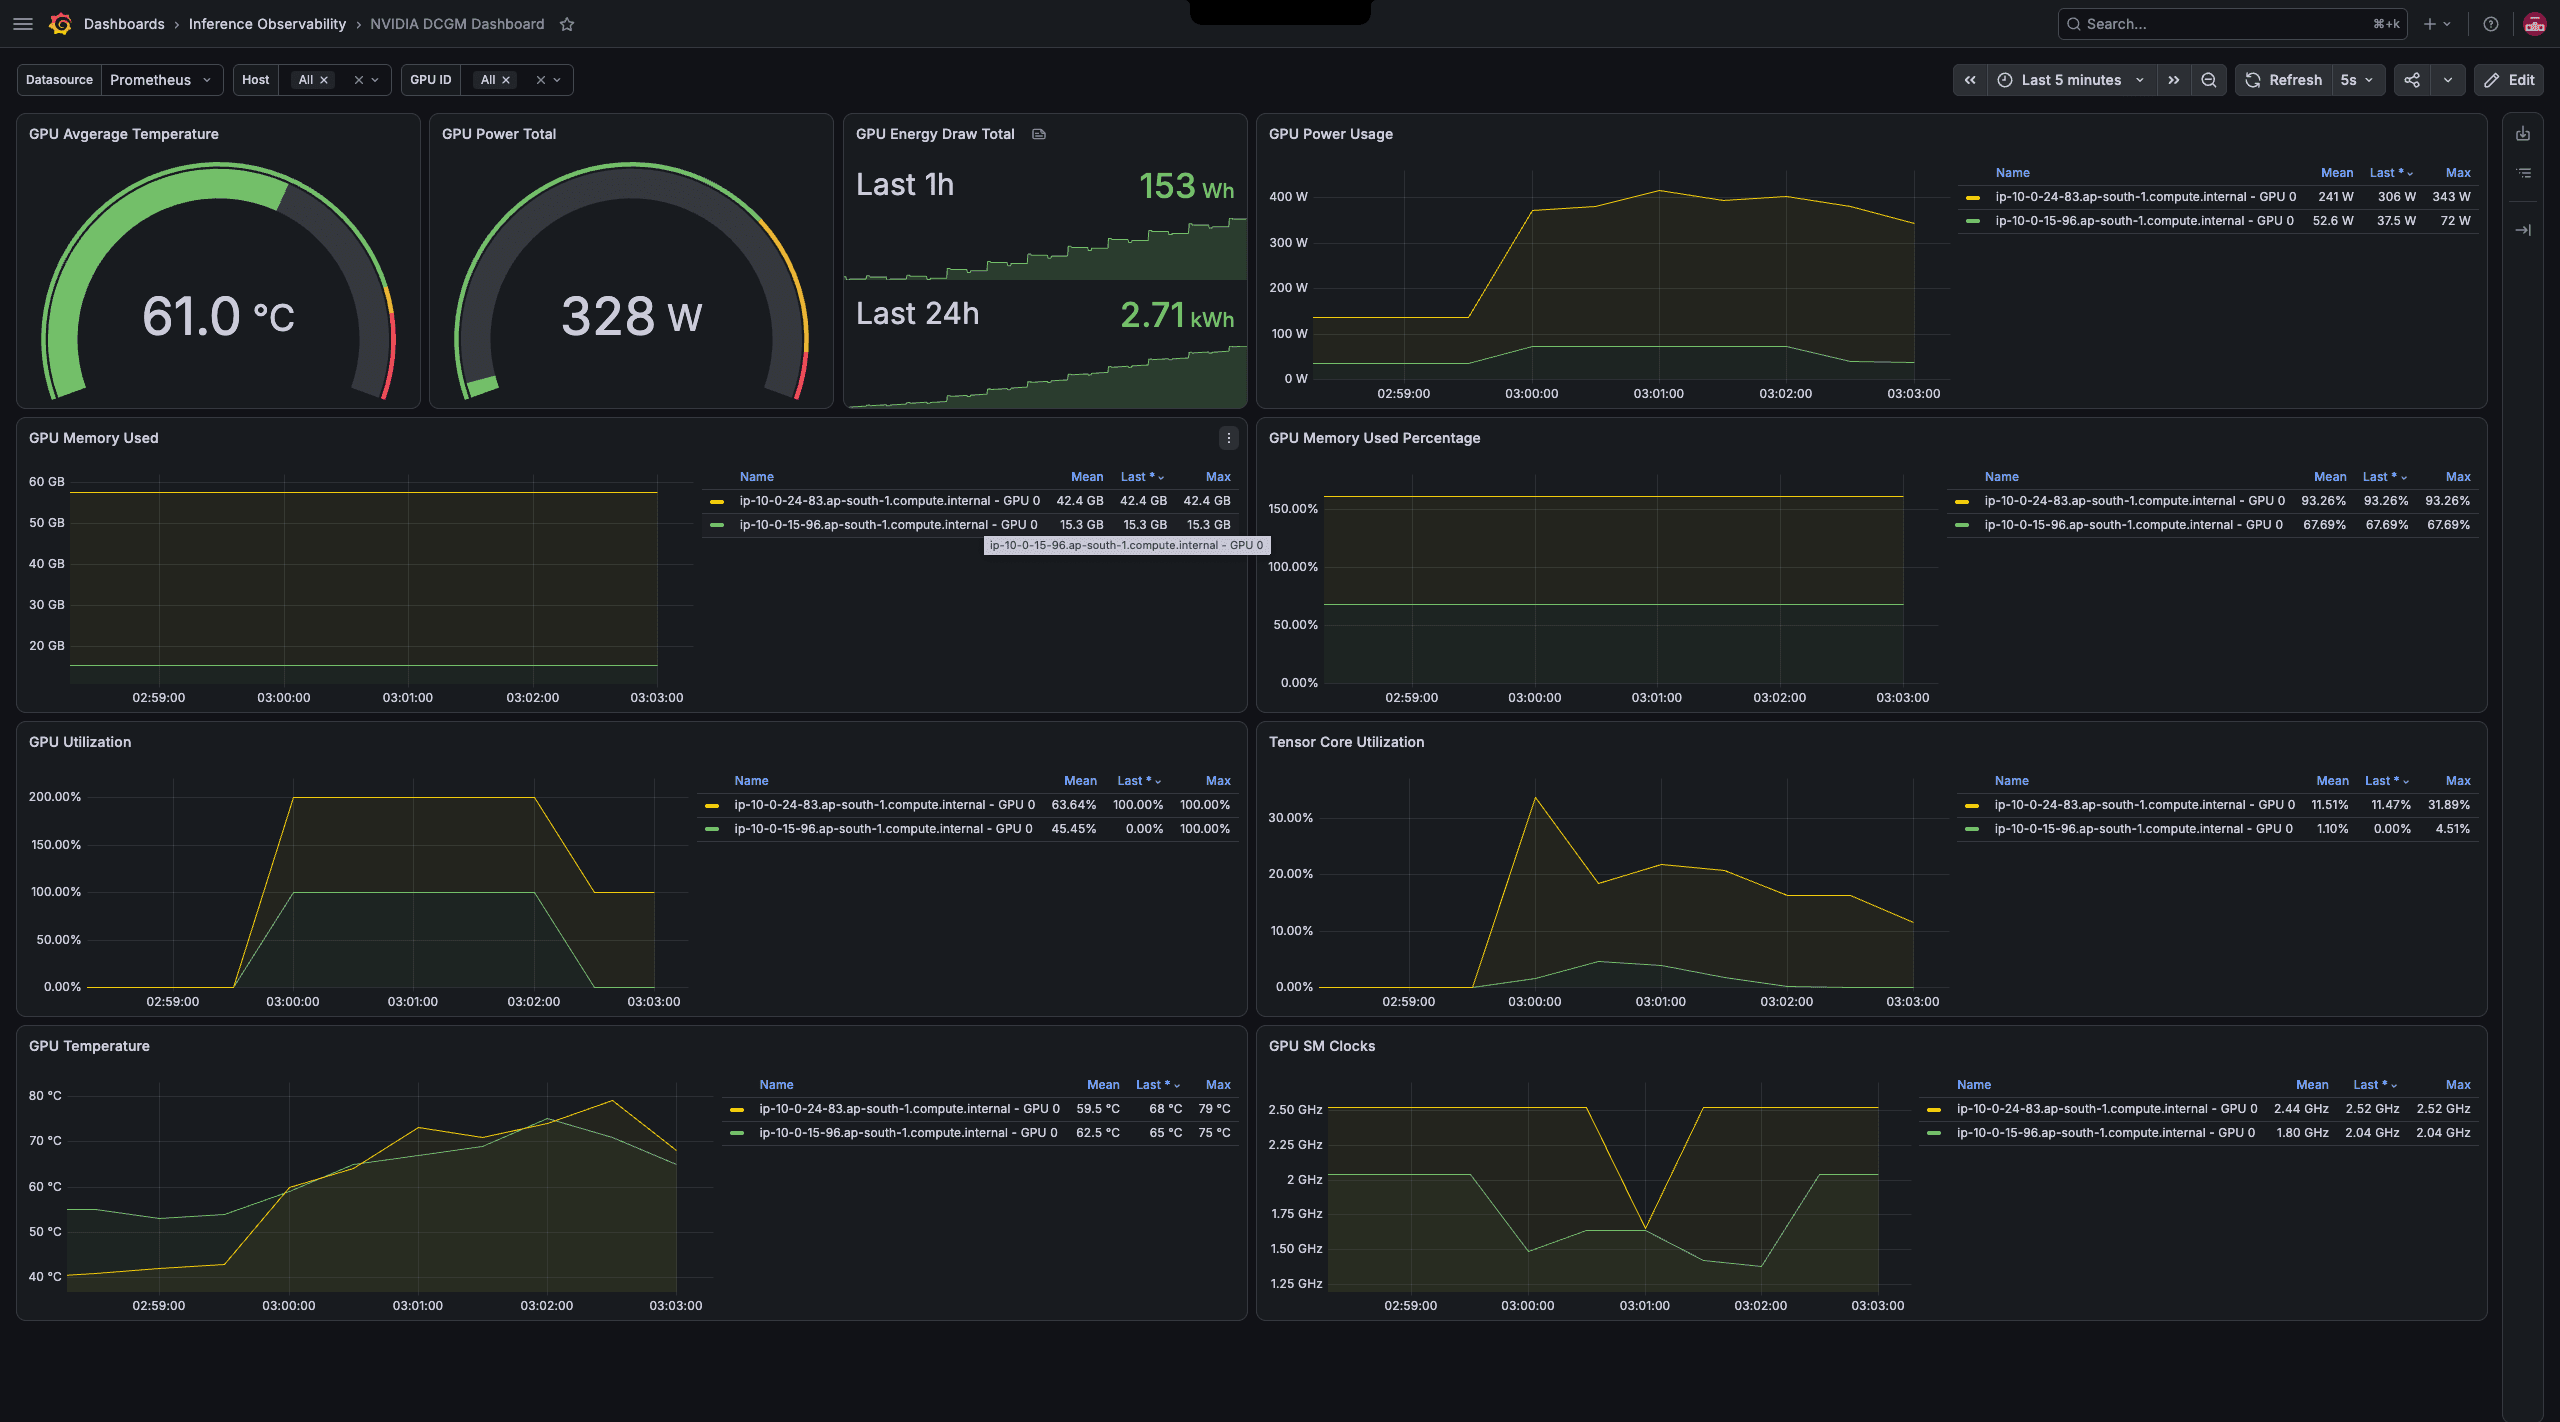
This works:
GPU utilization and memory flowing from the DCGM exporter. First real signal that the GPU layer is observable.
5: Serving models with llm-d#
We're done with cluster setup. Now on to the fun part.
Bifrost, the front door#
First, the AI gateway. Bifrost fronts all model routing so clients speak one OpenAI-compatible API and never touch a model service directly. Following the Bifrost vLLM docs:
kubectl create ns bifrost
kubectl create secret generic bifrost-encryption-key \
  --from-literal=encryption-key="$(openssl rand -base64 32)" -n bifrost

helm install bifrost bifrost/bifrost \
  --set image.tag=v1.4.11 \
  --set bifrost.encryptionKeySecret.name="bifrost-encryption-key" \
  --set bifrost.encryptionKeySecret.key="encryption-key" \
  -n bifrost
Once models are registered, every request flows through here, and Bifrost's own dashboard becomes the single pane for who's calling what, latencies, and fallback hits.
The Bifrost gateway logs: every inference request across models, with latency and routing in one place, including the calls that fell back to the hosted provider.
Understanding llm-d (v0.8.1)#
llm-d infra is set up distinct from model deployments, each of which has its own stack. A stack has:
- a model server (kustomize)
- a router (helm)
- a gateway (we skip it, since we route all models via Bifrost)
Each component has a base and scenario-specific overrides via kustomize, from the main
repo under guides/. We use the optimized-baseline guide.
Its baseline architecture is prefix-aware routing: requests sharing a prefix land on the same worker and reuse its KV cache. For agentic work, where the same giant system prompt prefixes every call, this is enormous.
The dream deployment: GLM-5.2 on H200#
The math on the frontier model is sobering. glm-5.2-fp8 takes 750 GB of VRAM, so 8× H200 cards are needed, giving 8 × 141 = 1128 GB, perfect for a 750B model alongside drivers and KV caches.
With H200s there are two P5 options:
p5e.48xlargep5en.48xlarge: same as p5e but with v3 EFA, enabling ~33% lower inter-node latency. EFA is what NIXL uses for inter-node KV cache transfer via LMCache. Since onlyp5en.48xlargeis available inap-south-1, that's the pick.
Start with a baseline single-instance deployment under llm-d. Node class and pool for the
H200 (karpenter/nodepools-glm52.yaml):
apiVersion: karpenter.sh/v1
kind: NodePool
metadata: {name: baseline-glm52}
spec:
  template:
    metadata:
      labels: {llm-d.ai/role: baseline-glm52, nvidia.com/gpu.present: "true"}
    spec:
      requirements:
        - {key: node.kubernetes.io/instance-type, operator: In, values: ["p5en.48xlarge"]}
        - {key: karpenter.sh/capacity-type, operator: In, values: ["on-demand"]}
      nodeClassRef: {group: karpenter.k8s.aws, kind: EC2NodeClass, name: gpu-h200}
      taints:
        - {key: llm-d.ai/role, value: baseline-glm52, effect: NoSchedule}
  disruption: {consolidationPolicy: WhenEmptyOrUnderutilized, consolidateAfter: 5m}
limits: {cpu: 192, memory: 2048Gi, nvidia.com/gpu: 8}Note on the node selector: nodeclasses can be reused generally, but models get their own nodepools. The node selector in the pod is what finds the right nodepool. A missing node selector means vLLM pods get scheduled onto unintended GPU nodepools.
So taints & tolerations along with node selector is crucial for exclusive model to instance affinity.
GAIE CRDs (version tracks the Gateway API version):
kubectl apply -f https://github.com/kubernetes-sigs/gateway-api-inference-extension/releases/download/1.5.0/v1-manifests.yamlThen the kustomize overrides. In the llm-d guides tree, add a glm-5.2 folder under
guides/optimized-baseline/modelserver/gpu/vllm with a kustomization.yaml and a
patch-vllm.yaml. The patch is where the model actually gets configured, TP=8 across the
eight H200s:
# patch-vllm.yaml (abridged, full version in repo)
containers:
  - name: modelserver
    command: ["vllm", "serve"]
    args:
      - "zai-org/GLM-5.2-FP8"
      - "--tensor-parallel-size=8"
      - "--kv-cache-dtype=fp8_e4m3"
      - "--gpu-memory-utilization=0.80"
      - "--tool-call-parser=glm47"
      - "--reasoning-parser=glm45"
      - "--enable-auto-tool-choice"
      - "--max-num-seqs=32"
    resources:
      limits: {cpu: '64', memory: 900Gi, nvidia.com/gpu: 8}
Install the router (standalone mode, via helm):
helm install $GUIDE_NAME $ROUTER_STANDALONE_CHART \
  -f $REPO_ROOT/guides/recipes/router/base.values.yaml \
  -f $REPO_ROOT/guides/$GUIDE_NAME/router/$GUIDE_NAME.values.yaml \
-n $NAMESPACE --version $ROUTER_CHART_VERSIONPulled: ghcr.io/llm-d/charts/llm-d-router-standalone:v0.9.0
NAME: optimized-baseline
NAMESPACE: infra-glm52
STATUS: deployed
Install the model server with the kustomize files:
kubectl apply -n $NAMESPACE -k $REPO_ROOT/guides/optimized-baseline/modelserver/gpu/vllm/glm-5.2/serviceaccount/optimized-baseline-nvidia-gpu-vllm-glm52-sa created
deployment.apps/optimized-baseline-nvidia-gpu-vllm-glm52-decode created
yeaaahhh 🚀
...not so soon#
Haaa, not so soon. The pod is Pending forever, because p5en.48xlarge simply isn't
available in the region. I tried to get a reservation. Nothing to be done: either run
smaller models on L4 cards, or wait and hope H200 capacity gets allocated.
So here's the honest reflection, and I'm leaving it in because it's true: regardless of models going open weights, a frontier model can't be run by a single person even with the funds to rent a card. All HBM cards from hyperscalers like AWS are rented out for months ahead by big techs.
Hard reality. But not so long, hopefully, until frontier open models are optimized enough to run on pocket-friendly hardware. Let's hope for the best.
The GLM-5.2 nodepool and overlay stay in the repo, ready for when capacity frees up.
Plan B: Qwen3.6-27B on L40S, same pattern#
Since I can't load the big model on one node, I go with what I can actually get. Deployed
qwen-3.6-27B-fp8 on a g6e.16xlarge
(L40S, 44 GB VRAM) under llm-d. 🚀 Same steps, model-agnostic platform.
Node class (gpu-l40s,
the instance has 1.9 TB of local NVMe so we use instanceStorePolicy: RAID0 instead of an
EBS root) and nodepool
(infra-qwen36/nodepools-qwen36.yaml),
then namespace and HF secret:
kubectl create ns infra-qwen36
kubectl create secret generic llm-d-hf-token \
  --from-literal=HF_TOKEN="hf_xxxx" -n infra-qwen36
Router via helm (the $GUIDE_NAME variables expand to this):
helm install optimized-baseline-qwen36 \
  oci://ghcr.io/llm-d/charts/llm-d-router-standalone \
  -f .../guides/recipes/router/base.values.yaml \
  -f .../guides/optimized-baseline/router/optimized-baseline.values.yaml \
  -n infra-qwen36 --version v0.9.0
Add the model server kustomize path under the optimized-baseline guide:
mkdir $REPO_ROOT/guides/optimized-baseline/modelserver/gpu/vllm/qwen-3.6The kustomization.yaml pulls in the base, the gpu-vllm image, and the monitoring
component (full file).
The OOM, and the benchmark grind#
Applied raw, the pod OOM-crashed immediately:
(EngineCore pid=521) torch.OutOfMemoryError: CUDA out of memory. Tried to allocate 1.53 GiB.
GPU 0 has a total capacity of 44.39 GiB of which 1.25 GiB is free. Including non-PyTorch
memory, this process has 43.14 GiB memory in use ...
Though the model is just 27B, it consumed all 44 GB. That's headroom allocation for the KV
cache and the max sequence batch count (default is 256 in vLLM). In production you set
--max-model-len and --max-num-seqs explicitly, by benchmarking the setup for an optimum
number. And when MTP (multi-token prediction, speculative decoding) is introduced, memory
takes another hit, so --max-num-seqs has to come down further.
On a GPU constraint, you optimize for either throughput or performance. Since I can
load qwen3.6-27B-fp8 in a full g6e.16xlarge, I tune for performance and scale throughput
horizontally with KEDA.
So I ran the grid, at 128k context window (non-negotiable for agentic tasks):
| Config | max-num-seqs | Result |
|---|---|---|
| no MTP | up to 160 | 18.9 tok/s |
| MTP=2 | 16 (breaks at 160) | 23.4 tok/s |
| MTP=3 | 16 | 43.8 tok/s (+135%) |
| MTP=3 | 32 | 48.6 tok/s ✅ |
| MTP=3 | 40 / 50 | OOM crash ❌ |
The method I used: set a comfortable MTP first, then slowly raise max-num-seqs
from there until it crashes, and back off one step. For this stack, 32 is the ceiling.
Final config:
L40s ~ 44Gi usable HBM  |  g6e.16xlarge
MTP = 3                 |  --speculative-config qwen3_next_mtp, num_speculative_tokens=3
CW  = 128k              |  --max-model-len=128192
max-num-seqs = 32       |  concurrent token processing
That's ~2.5× the naive throughput, found by actually running the numbers. The vLLM args
that encode it (full patch-vllm.yaml):
command: ["vllm", "serve"]
args:
  - "Qwen/Qwen3.6-27B-FP8"
  - "--gpu-memory-utilization=0.95"
  - "--tensor-parallel-size=1"
  - "--max-model-len=128192"
  - "--reasoning-parser=qwen3"
  - "--enable-auto-tool-choice"
  - "--tool-call-parser=qwen3_coder"
  # MTP
  - "--speculative-config"
  - '{"method":"qwen3_next_mtp","num_speculative_tokens":3}'
  # 160 breaks | 150 works; 32 is the sweet spot for perf on l40s + qwen-3.6-27b
  - "--max-num-seqs=32"
Install the model server:
kubectl apply -n $NAMESPACE -k $REPO_ROOT/guides/optimized-baseline/modelserver/gpu/vllm/qwen-3.6/That's it. The model is live on the EPP (router pod) service:
http://optimized-baseline-qwen36-epp.infra-qwen36.svc.cluster.local:80/v1
Register that in Bifrost and it's a routable production model.
woww!
llm-d observability#
The vLLM pods already have PodMonitors from the kustomize monitoring component:
# kustomization.yaml
components:
  - ../../../../../recipes/modelserver/components/monitoring
The catch (same as before): it needs release: kube-prometheus-stack for our stack to
pick it up. I added the label to
guides/recipes/modelserver/components/monitoring/decode-podmonitor.yaml, then re-applied
the overlay. With that in, the standard vLLM dashboard lights up.
vLLM's serving metrics in Grafana: throughput, token latencies, KV-cache usage, and running vs. waiting requests per pod.
For router/EPP monitoring, add this to guides/recipes/router/base.values.yaml, then
helm upgrade:
monitoring:
  interval: "10s"
  prometheus:
    enabled: true
    auth: {enabled: false}
Then I built a custom Grafana dashboard for the EPP metrics, since a good one isn't
available online (monitoring/llm-d-epp-dashboard.json).
The custom EPP dashboard: queue size, routing, per-pool state. This is the exact signal KEDA scales on.
6: Scaling with KEDA#
One replica isn't a platform. But scaling GPU workloads on CPU% is nonsense, a vLLM pod pinned at 100% GPU can show trivial CPU. You scale on a serving signal.
First, a gotcha: my nodepool was limited to a single node, so Karpenter could only ever
spin up one node even when KEDA asked for more. Bumped baseline-qwen36 limits to fit 4:
limits: {cpu: 256, memory: 4096Gi, nvidia.com/gpu: 4}Install KEDA:
helm repo add kedacore https://kedacore.github.io/charts
helm install keda kedacore/keda --namespace keda --create-namespace --wait
Then the ScaledObject
(infra-qwen36/keda-scaledobject-qwen36.yaml).
The signal is the EPP pool's average queue size, pulled straight from Prometheus:
apiVersion: keda.sh/v1alpha1
kind: ScaledObject
metadata: {name: qwen36-decode-scaler, namespace: infra-qwen36}
spec:
  scaleTargetRef:
    apiVersion: apps/v1
    kind: Deployment
    name: optimized-baseline-nvidia-gpu-vllm-qwen36-decode
  minReplicaCount: 1          # floor while there is any traffic
  maxReplicaCount: 4          # nodepool baseline-qwen36 GPU limit
  pollingInterval: 30
  advanced:
    horizontalPodAutoscalerConfig:
      behavior:
        scaleUp:
          stabilizationWindowSeconds: 600
          policies:
            - {type: Pods, value: 1, periodSeconds: 300}   # at most +1 pod / 5min (matches startup)
        scaleDown:
          stabilizationWindowSeconds: 600
          policies:
            - {type: Pods, value: 1, periodSeconds: 600}   # at most -1 pod / 10min
  triggers:
    - type: prometheus
      metricType: Value
      metadata:
        serverAddress: http://kube-prometheus-stack-prometheus.monitoring.svc:9090
        metricName: epp_pool_queue_size
        query: sum(llm_d_epp_average_queue_size{namespace="infra-qwen36"})
        threshold: "5"          # add a pod when avg queue/pod > 5
The pace is deliberately matched to reality: +1 pod per 5 minutes, because a cold vLLM pod takes about 5 minutes to warm up. We could make it more reactive by shrinking the threshold and stability window, but it's fine for now.
The two autoscalers, chained#
Here's the elegant bit. KEDA and Karpenter don't know about each other, but they chain perfectly through the pod scheduler:
KEDA answers "do I need more replicas?" Karpenter answers "is there a node for this pod?" The pending pod is the handoff. When load drops it runs in reverse, and you stop paying. Nobody touches a thing.
that's it 🚀.
A complete llm-d stack with full observability and event-based autoscaling. 🍾
7: Why do this at all?#
All of the above is a lot of work. A hosted API is one line. So let's be honest about why you'd run your own, because the reasons are real and they compound.
The economics: overflow, off-hours, overall savings#
The headline is concurrency-per-dollar. One large node holds ~30 concurrent users at 128k context. Once you're serving a team, owning the hardware starts to win, but only if you're disciplined about idle cost. The model that makes it defensible, straight from the plan at the top:
- GPU nodes shut down at night, with fallback to Claude. You don't pay for GPUs while everyone's asleep.
- On queue overflow (30 deep), spill to the hosted provider instead of degrading everyone. Size for the common case, not the peak.
- Price the self-hosted model equal to
sonnet-5in the gateway. Now every request logs a cost as if it hit Claude, and real savings are just that number minus the cluster cost delta. The spreadsheet writes itself. - Optimized throughput compounds it. That 2.5× from the MTP grind is 2.5× more users per node, which is directly fewer dollars per user.
- More concurrency from llm-d disaggregation, the next lever once the pool saturates.
The things a hosted API can't sell you#
Cost is the boring reason. The interesting reasons are capabilities you cannot rent:
- Sliding-window prompt caching. Agentic workloads hammer the same enormous system prompt every call. With prefix-aware routing and KV-cache reuse (LMCache under llm-d), that prefix is computed once and reused on the same worker. You own the cache policy. On a hosted API you get whatever caching they decide to give you, priced how they decide.
- Request tiering, including batching. When it's your engine, you decide what's interactive and what's a background batch job. Latency-sensitive agent turns get priority; a bulk re-embed or overnight eval gets batched into throughput which'd otherwise go waste. You can't tier requests you don't control.
- Fine-tuned, uncensored, cyber-focused models. Run models tuned on your own domain, models without guardrails that refuse legitimate security work, models built for cyber and offensive-security tasks that no commercial provider will serve. For a security team, "the model won't refuse to analyze this sample" is not a nice-to-have.
- Your own in-house models, full stop. Train it, quantize it, serve it. This platform is model-agnostic, it served the GLM-5.2 overlay and Qwen3.6 with the same machinery. Whatever you build, it runs, on your hardware, under your rules, with your data never leaving your VPC.
That's the thesis. Economics get you in the door. But you stay because once you own the serving layer, you own the system end to end: caching, tiering, custom models, data residency, refusal policy, all of it yours to decide instead of yours to accept.
Where it landed#
Start to finish, this is a real production inference platform on kubernetes:
- GPUs managed efficiently: Karpenter just-in-time, spot for prefill, on-demand for decode, aggressive consolidation so idle cards don't bleed money.
- A model served the production way: Qwen3.6-27B-FP8 under llm-d v0.8.1, tuned through a real benchmark grind to 2.5× its naive throughput.
- Autoscaling on realtime signals: KEDA on EPP queue depth, chained into Karpenter, up under load and down to nothing when idle.
- One hardened front door: Bifrost behind a TLS, IP-allowlisted Istio gateway, with a hosted fallback so nobody hits a wall.
- Observable end to end: cluster, GPU, and serving metrics, plus a custom EPP dashboard showing the exact signal that drives scaling.
The whole infra artifacts are in
gd03champ/inference-infra, manifest by
manifest, with a folder README for every component discussed. It's a runbook in itself: the OOM and the Pending
pod are in there too, because that's what building this actually looks like.
Screenshots throughout are from the live cluster. If you're building something similar and get stuck, the repo issues and contact are open.
signing off